E-SCOOTERS WAR – BONANZA for DATA SCIENCE people

They are Cinderellas. Most people look at them with disdain. They combine slightly lower comfort with more effort. And this is, let’s face it, not exactly the most lucrative combination you can think of. However, they are more spatially concise and thus more practical as well. And if you add electricity to them, that’s already another level.

Have you guessed what the previous mysterious paragraph referred to? Yes, we’re talking about scooters, my favorite vehicle. Berlin is a city strongly inclined to cycle traffic. Over 500,000 people are estimated to travel here every morning on various forms of (human-powered) wheels . Yes, you read correctly: 500,000 people every morning. Berlin hosts incredible 620 km of cycle paths or sidewalks built within the city. What is more, in Berlin, as in one of the few cities around the world, bicycles can even be taken to the subway. Simply a cycling paradise on Earth.

Scooter metamorphosis

But back to scooters: Two years back, when I started riding my scooter around streets of Berlin, I met with general amazement and sarcasm. Some of the “real cyclists” have even mocked “if they didn’t have pedals in the bike shop when I was there.” (the fact that the funny cyclist with his pedals did not catch up with me ever after that day, I leave aside for now). However, the situation around scooters has changed significantly over the last 18 months. Electric scooters entered the game.

The austerely designed scooters, equipped with an engine, can go over 20 km/h. Their main advantage is that you do not need a driver’s license to rent them, so they can be borrowed by anyone, whether you are a tourist or a local citizen. This is probably just one of the reasons why literally a “scooter war” is raging in the biggest German cities. According to independent estimates, more than 4800 electric scooters operate in Berlin alone. To put it in context, there are approximately 4,000 streets in Berlin, so there is already more than one electric scooter per each street street today. The purpose of this blog, though, is not to delve into the comparison of market shares or the quality bench-marking of individual services; (this is done well here) Electric scooters conceal one more interesting surprise.

The combination of their considerable number and the fact that each scooter is equipped with a number of sensors create a very interesting data sets for many (not just scooter operation relevant) Data Science analyses. This, at first sight inconspicuous, corner of data analytics even made it last month to its own topic of AI Meetup, here in Berlin. Hence, I can give you first hand report on what you can actually analyze around scooters.

When and where to place them

I remember a little embarrassing start of bike-sharing application in my home town, where initially the problem was mainly that bicycles were not where they were in demand, and on the contrary, they parked abundantly in places nobody desired them to be. The main reason for such a disparity is fact that the flow of traffic in the city is not symmetrical. If a taxi driver takes you in the evening from the center to the suburbs, it would be naive for him/her to stay in the suburbs waiting (in order to maximize fuel efficiency) to drive someone in the opposite direction at night. Obviously (s)he would have to wait until morning when everyone was back in town. However, as time is money, it is better to take the car “at own expense” back to the center, where it easily gets another order. What we consider to be quite logical for taxis, for scooters, takes a completely different dimension. The scooter cannot (for the time being) move itself and therefore it is necessary (several times a day) to transport scooters between individual stations when operating such a sharing services. And here comes the first data science opportunity that needs to be resolved: “When and where should scooters be relocated so that the cost of relocating them is covered by additional revenue from the new location where you put them?”

RESIZED_CIRC_02_starting_positions

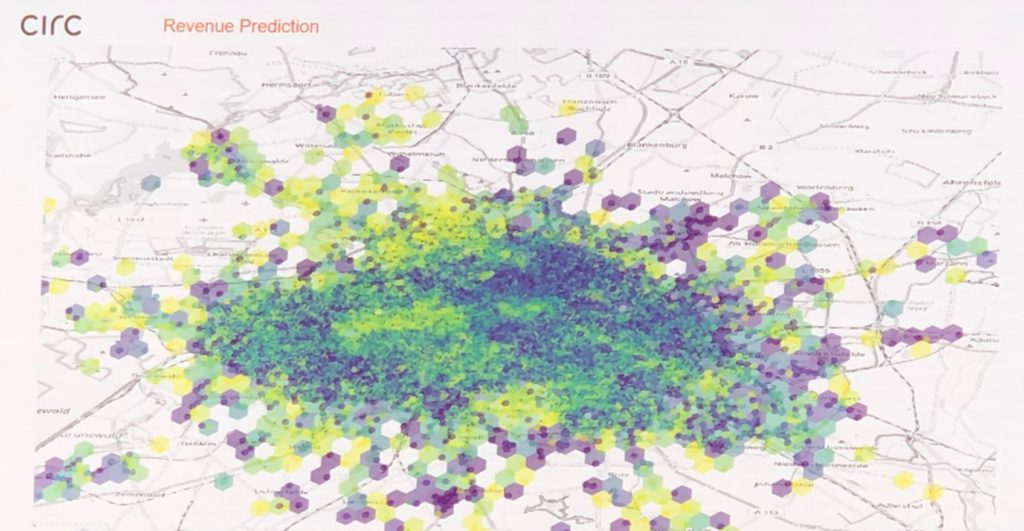
The figure above illustrates how one of the scooter services in Berlin took up this task. They have created a demand map based on their driving history data. However, demand is not in frequency measure, but directly in revenue value. A different shade of points indicates how much revenue a scooter (on average) achieves when starting from that very location. Therefore, it is necessary to pair up places with pale color with closely neighboring dark points. Add a radius that a person is willing to go to fetch a free scooter and you have a preliminary plan on how to move them. That it really works like that I saw one evening with my bare eyes: The delivery of the one of the companies stopped at a place where there were suspiciously too many scooters, the driver got off and put some of the scooters on the hull, ordering the other in line. And off he was to a better place for them.

New energy influx

VeoRide's e-scooter with a swappable battery makes scooter sharing safer, greener and more efficient. Introducing the only commercial e-scooter on the market with a re-chargeable battery that can be switched out on the spot, keeping scooters available 24/7 and eliminating the risk associated with juicers or "crowd chargers" who must re-charge in their dorm or apartment.

Scooters need to be “visited” not only because of their location, but also because they are electric. If you rent a car, you are obliged to refuel it. However, you rent a scooter for a few minutes and you do not have a place to refuel it with electricity. (Although there are first attempts to motivate last-in-the-day users to take the scooter home and recharge it overnight.) In addition to relocation logistics, scooters’ batteries also need to be replaced. (Which is faster than recharging them on site.) Of course, it would be ideal if the scooter transfer could be combined with a battery change, but the battery would also run out of scooters that are in optimal locations or where there are enough other scooters, so one less charged piece can quietly wait there until the next visit of the charging patrol. How long routes do people usually make from the place where the scooter is parked? What is in reality a critically low battery state for that location? And what recharging the battery at this stage will mean for the overall battery life in the future? These are just some of the considerations that a data team planning to replace batteries needs to count into overall optimization decision.

User profiles and micro products

RESIZED_CIRC_03b_placing_parameters
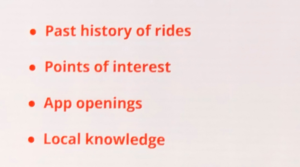
As with any service provider, for scooters, the main goal is to get to know their users. Because if you do not want to bite you nails every morning, with worries if you earn enough today, you need to know the habits of your clients. Hence, a separate topic of Data Science help is client segmentation with assignment of expectations and commercial value for each of the segments. A person who rides your scooter to work has a totally different customer value than a tourist who has tried your service out of the curiosity. On the other hand, a regular user will be much less tolerant of a missing or damaged scooter near his home. And since competition is numerous, any disappointment of regular clients can easily lead to their loss. It is, thus, super important to properly design the micro products (weekly ticket, offer of the day, …) to keep the client loyal.

When to see the doctor

Like any thing that does not have one owner, the biggest Achilles heel of shared scooters is that they have many users, but none of the scooter-caring “owner”. In addition, the scooters have mostly subtle (less than 12 inch) wheels that get tough times when the scooter is highly busy. Although the feedback from experienced defects gradually helps to boost the lifetime of individual scooter models (by adjusting their design), most of the current riding units will not live for more than 14 months; In really busy locations this value can fall as low as 10 months. Even though this may seem a complication especially for scooter companies at first glance, in real life it is more of an inconvenience for the end users. Imagine using a scooter to commute to work. You see on the map that some piece is available, so you can count on it on this mode of transport for your way to work . However, when you come to a scooter, you find that it is broken and you are left in limbo how to meet your first meeting starting time. Too bad. Now even discussing the scenario that your scooter damages within your ride, exposing you to real life-threatening moments.

RESIZED_CIRC_04_predictive_maintenance
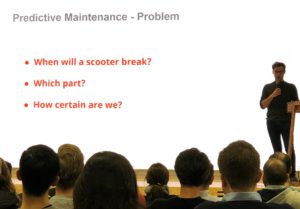
Therefore, one of the key topics of data analytics in this industry is fault prediction (technically called predictive maintenance). If historical failure data are correctly recorded, it is possible to see which factors of use increase or decrease the failure likelihood. At the same time, the company has complete information on what kind of usage are currently undamaged units subjected to, it can identify specific vehicles that are likely to break down in the coming days/hours. Since the individual scooters (as discussed above) need to be relocated regularly, the by next relocation schedule the actual malfunctioning can be prevented by replacing the soon-to-fail piece with a new one. This significantly reduces the risk of inconvenience to final clients and also prevents injuries. All this, though, requires one more interesting analysis, which we will turn to in the next paragraph.

Quo vadis

RESIZED_CIRC_06b_routes_profiling_aftermath.jpg
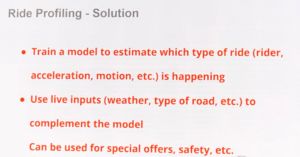
At first hearing, it seemed to me as an unnecessary academic exercise. But the more I had the chance to discuss it with the insiders, the more it made sense to me. Yes, we are talking about profiling roads ridden by scooters. As shocks are an unwelcome “pleasure” for both fine electronics and wheels, knowing how much time the scooter has traveled on which surface has been an important factor in predicting wear. Likewise, when did the scooter went downhill or up the hill, as it strains the physical parts of the scooter more than on the flat ride profile. Last but not least, it is important to know where the ride happened also due to cycling lanes coverage or risk of accidents in individual sections. Thus, the most advanced analytical teams extend map data with layers of data such as which streets have cobbles, what slope a given street has, or how many of our own service (and other road accidents, e.g. by cyclists) have taken place at each location. Initially, this data is likely to be used for internal scooter operation and technical improvement purposes mainly. However, later a different price per kilometer is also possible, depending on where exactly did the scooter drive through, to take into account wear (and indirectly motivate people to drive on more gentle surfaces.)

Try on your own, maybe …

If you are interested in scooter data, there are already several Open data sets that are freely available. So far not directly from Berlin, but apparently for start that does not matter that much. Thus, if this article have “got you started” to analyze scooter data, try one of the above tasks on the Open data sources on your own. Maybe you will be get attracted to work in one of the scooter companies. Or at least it pokes you to try some e-scooter service first place.


DO YOU WANT ALTERNATIVE to GOOGLE JOBS? TRY …

If one is serious about his career as a data analyst, (s)he naturally becomes attracted to the idea of working for one of the industries with fastest data growth. After all, that’s where the cake of the future is ‘baked’. That is exactly the reason why Telecom companies and banks were ‘magnetic’ in the 1990s, E-commerce after 2000 and social media mainly in the last decade. But do you know what is already “in the oven” for the next period?

Many might say that Google must be the best place for a “data analyst” to go wild with . After all, hand on Bible, what does Google not know about us? Well, you might be surprised that if we take individual Google services one by one, there are companies that have far more data than these single Google products. Are you shaking your head in disbelief? Maybe time to correct your opinion.

Storm Phenomenon

If you want to guess on your own which industry we are talking about, here are two more hints for you: 1) Group activities always generate more data than individually created content; 2) Motion data (e.g. video) provides much more variables to analyze than still images, audio tracks, or plain text data. If you dare to guess what the industry it is, then stop reading here for a while (the next paragraph reveals the correct answer). The rest of us, we are jumping straight into it.

Digital games are currently undergoing phenomenon Fortnite. This game currently host approximately 200 million MAU’s (= monthly active users) and peak concurrent number of usersfortnite_logo reaches 8.5 million of players from all around the Globe. As it is a multi-player game, its creators (EpicGames studio) must carefully store what each player has done, as the interactions of the players are what determines if your character has survived or you are dead (and hence out of the game). In Fortnite (under the guise of the incoming cataclysmic storm), the game space is constantly shrinking, inevitably leading to clashes of the individual characters (of players), confirming that Darwin was not mistaken, after all.

The very need to document the movement of all the characters and their mutual interactions makes the game an unusual data fire hose. Imagine this as (data encoding of) videos of 8.5 million simultaneously moving people in different locations. Fascinating, isn’t it? According to Amazon Web Services (AWS), who manage data storage for this game, the data volume reaches ranks of 95 PetaBytes (and still continues to grow). That is volume comparable to the complete Google Index for searching among all available Internet pages. Would you think the game may be bigger than Google? Yes, search is just one of Google’s services, but Fortnite is just one in tens of thousands of digital games as well. (Though admittedly, the biggest now)

New magnetic industry

OOnline games are really phenomenal. In the United States alone, gaming industry revenue grew at an impressive 18% per year in 2018 (based on data from Entertainment Software Association). With this growth, the gaming industry is one of the fastest growing industries at all and it employs more than 200,000 people in the US alone. How can this industry move forward so quickly?

For several decades, the gaming industry has behaved similarly to film studios. A large number of mutually (indirectly) competing film teams have brought hundreds of films to market each year with hope that some of them will turn into hits. Most films barely earned back production costs (and actors’ pay). But a few of them became bull-eye-hit, earning hundreds of millions of dollars and covering for money black holes of “shabby movies.” Yes, even game studios have produced hundreds to thousands games (of different genres) year after year. And then they prayed that the games would find their sufficient audiences. The gaming industry back then was reliant on ups and downs, their economic results resembling rather a roller-coaster than the steady growth pattern of today. So how is it possible that it has been showing long-term growth, moreover economically so outstanding growth, lately?

The data are the essential ingredient added that has brought strong winds of change. Nowadays, computer games are designed today to keep manufacturers aware of which parts of the game were attractive or boring to users, (to resignation point) difficult or unbearably light, on contrary. By systematically tracking player preferences, developers have learned to calibrate the story in game to glue players to the screens for as long as possible. This increased the overall size player audience. Praying for hits has turned into factory of successfully targeted games. This phenomenon bulldozered the “hills and valleys” in the success curve of game studios. (Well, at least those valleys, hills like Fortnite pop-up still here and there). However, this was not the only data effect in the gaming industry. In fact, the data has brought for the industry two (even more important) trump cards.

Two more trumps

The original business model tried to collect the entire monetary value of the game from a potential player already upon buying the game first place. However, this is as if you had to pay for the house without going through it in detail or without spending some nights in it. This approach encouraged software piracy, as all you needed to have game at disposal for rest of life, was to get to the cracked version of it. (Imagine that the house and the land would become yours for life-time only by having a fake copy of the door-key produced by nearest locksmith. Many people would not resist this mounting temptation. And so it was with the games, as well).

With the data on how players progress in each part of the game collected, game studios we enabled to place “paid shortcuts” in parts of the story where many players got stuck. For a few euros, the game offered you hints, missing resources to build, or an object/skill for your avatar. Suddenly, the game monetization tables turned swiftly around, looking at problem from other side: Now, it was in the interest of the player himself to purchase this paid help. As if you wanted to install a climate in your house before summer. You surely will survive without it, but it will cost you more effort in middle of the hot summer. And you can no longer enchant air conditioning unit into your house with a fake key (you entered the house first place), you have to properly order its installation and paid for it. This second data effect has proved to be much more important than originally thought as gathered stats show that 43% of all gaming revenues on mobile and tablet platforms are generated from in-game purchases and extensions.

The third trump that data brought to the gaming industry lays in creation and testing of new game content. Having a successful game like Angry Birds, or any of those huge hits, sounds like a blessing. Millions of people play the thing you programmed once back then, and your account literally beeps with new and new money flowing in.

ANGRY_BIRDS_dream_blastBut this rosy it looks only if you are the business owner. A less optimistic shade surfaces for you if you are a developer charged with task to program the very game. According to the data published at the conference NOAH LONDON 2019, huge demans of players of new Andry Birds Dream Blast game requires that the company has to create 40 brand new game levels each week. If you don’t scowl on the this tempo yet, I’ll try to put it into context: The average working week is 5 x 8 = 40 working hours. Hence, the developers team of this game must devise, program, test and deploy a new level every working hour. Every single one! Surely, you can have an army of programmers working in parallel to catch up and program a new level of play in below hour. But how can you thoroughly test a game level within a given hour interval when a single run of play may require a few minutes itself? Even with battalion of 100 testers, after the development of the level itself, they would be able to play it in remaining time of hour perhaps 500-600 times at max. And that is too little for company to understand how millions of different users will rate the game. So the role of data comes in here again.

Because gaming studios have huge stacks of game (and other similar games) historic data, they can profile typical player profiles that are represented throughout the game’s enclave. (Some people play just to complete level, somebody is not satisfied until they reach highest score, yet another do not aim at ending the level at all, they just enjoy various funny failed attempts at puzzle’s solutions …) The studio trains a neural network (using reinforcing learning) that simulates playing every distinct gamer type. Subsequently, in the cloud environment (like AWS), many copies of virtual players (thousands for each type of them) are created and they are handed over the newly designed game level for play. This will leave the company with a large footage of feedback on proposed new level’s perception. More importantly, such digital data testing is starkly scalable, since you are not limited by how many different player types you have or how many different levels you have created to test today.

So, how about you?

This closes the sequence of 3 major data effects on the gaming industry into a strongly expanding spiral. It does not matter whether you prefer to run data players analytics, to investigate individual game components, you are more fascinated by looking for suitable traps of in-app purchases, or simply enjoy to seek constructs of new game levels. There are certainly many interesting analytical opportunities in the gaming industry. Thus, if you work in one of the already boring sectors (banks, utilities, insurance companies, …), it may be time to look around the gaming sector. And you don’t even have to pack your suitcases, small countries like Slovakia solely host more than 20 game studios and even these small markets launch north of 70 new game titles per year. Companies like PIXEL FEDERATION has built strong enough reputation to stand competition with world top players. If you dare to move abroad the options are almost endless. So, how about you? Do you want to get into play with Gaming data or do you still want to head for Google job?

Want to Learn AI? Break shopping-window in Finland

Most of the scientists, dealing with robotizing of human labor, say that people who cannot work with Artificial Intelligence (AI) will not be replaced by AI alone, but by people who can understand AI. So learning at least the bare basics of artificial intelligence will be very important factor for survival in the labor market. But how to get to AI?

Broken shopping-window

Maybe try Finnish prison to get AI know-how? No, this is not a joke. Although, I will of course not encourage you to commit crime. The reason, why I mention the Finnish prison, is the unique AI program that the Finnish government has decided to introduce.

We have already talked here at TheMightyData about Finland’s attempt to become a tiger in artificial intelligence. We also mentioned, how they strive to train 1% of the population for Artificial Intelligence, so that these people would form a backbone to develop this topic across the state. Finland has rightly understood that a country will not be able to broadly implement AI tools, if the only persons familiar with AI are the academic circles clustered in university hubs or research centers. Artificial intelligence will – for example – never prevail in the dentist industry, if the nature of AI is not known to dentists themselves. Therefore, the Finnish Government intensively designs programs to make artificial intelligence as wide-spread as possible for the population.

Behind the bars

PRISON_handsAnd so the prisons came to focus as well. The Artificial Intelligence Instruction Program, developed by the University of Helsinki, has become an official re-qualification program for prisoners since May 2019 to improve their labor market chances after end of their sentence. Prison in Turku, south of Finland, has indeed purchased computers and tablets from a government grant and real AI lessons have been already launched in there. That it is not a pseudo (or pretended) attempt is confirmed by the fact that for AI course exercises the prison had to allow access (white-list) set  of websites from which the course grabs needed data sets. Completion of the course ends with an official certificate for inmate. The University of Helsinki even committed to grant convicts credits for the passed courses, so that they can study the full science degree after being released from the prison. The program, running in Turku since May 2019, will be now extended to 3 more prisons in the country as of this month.

For the sake of fairness, for Finnish prisons, this project is not the first contact with artificial intelligence. Prisons in Turku and Helsinki have already introduced an interesting type of work for prisoners. For the training of artificial intelligence models, so-called annotated examples are important. (if you haven’t heard of them, try to read THIS). However, these are difficult to obtain, because the annotation (to a large extent) still has to be done by a person and it is often quite unrelenting, repetitive work. Who in society will not rebel against such monotonous work? Yes, the prisoners are those who can’t choose their job that much. Prisons have thus taken up the idea that prisoners could just annotate large numbers of data files and this way speed up the development of AI models.

How to do Artificial Intelligence in Slovakia

The drafting of a Strategy on how to introduce the elements of artificial intelligence into the business of the society is the cause of almost every developed country in the world. PRISON_AI_straegy_2Some are more original and aggressive (like Finland), some countries are content only to copy the US, China or Japan. Slovakia is now also in this creation process and since I am honored to be part of it, here you can read what discussions on this topic were held in the team preparing this Slovak AI strategy.

Therefore, if you’ve met Artificial Intelligence so far, just “from safe distance”, you don’t want to be imprisoned in Finland but want to be clear at least about the basics, I suggest reading some book on how they work. If AI raises some (Terminator) like concerns, here is the good take on how we humans should train the robots. You maybe also be interested in how to Safely train better robots for future. Or write me any question you have on this topic at info@mocnedata.sk and I will try to either answer you directly or point you to the source of the information.

How MUSIC IS MEASURED? How many SONGS does SPOTIFY want us to listen to?

How much music have you consumed in the last week? “That’s easy,” you say probably. After all, the music is quite well countable. You can either count the number of songs, OR – if you want to be even more precise – you can count the total seconds the music sounded. So what’s the loophole, here?

Well, the music at first glance really looks as countable as cheese, potatoes or crows on a telegraph pole. But that is true only as long as you count it for yourself solely. If the music is to be traded, suddenly all traditional metrics are of no use anymore. Not convinced? Well, then next time you go to music store, try to ask for 245 seconds of rock-n-roll and 720 seconds of classical music, please, packed separately, so it does not mingled. Do you get the point?

Measuring Medieval music

In fact, the sales units of music have changed significantly throughout history. In the oldest times, music could not be stored. There was no medium on which to record the music, so the music was only sold per unit of experience. In today’s notion, it would be a unit of measure like “one concert“. As with other medieval measures (such as thumb or elbow) there was no standardized form of that measure, and so the length (and intensity of the concert) depended largely directly on standard of the individual musicians. 3-Z1-R1 J.Zick, Familie Remy in Bendorf/ 1776 Zick, Januarius 1730-1797. 'Die Familie Johannes Remy in Bendorf bei Koblenz', 1776. Oel auf Leinwand, 200 x 276 cm. Nuernberg, Germanisches Nationalmuseum.

AUDIO_kazetaThe invention of a gramophone (and soundtrack recording) had brought a fundamental revolution in music units. Music suddenly stopped being sold in experience units (which will have its historical implications, but we will revisit it later), but the the music medium has become the unit of music. Firstly (gramophone) vinyls, then magnetic tapes and CD’s ultimately. Since most of us were born already into this set-up, we don’t find it strange. However, when you get a little historic zoom-out, you may realize that selling music by a “medium unit” is like selling sausages by area of the packaging or health by number of blood cans. On other words, it is not important how much benefit you buy in the package, literally, only the size of the package matters.

Generation after generation, we had learned to live with this music measuring “defect” and kept on buying albums. There were only two units in the album metric system: 1 Album and 1 Single and it was set that the Album is bigger than Single in terms of songs or seconds. It is crucial to note (for out further discussion) one more important fact: According to the (back-then) contemporary music sales stats, the Albums to Singles ratio was 179: 1. Thus, the Single’s accounted for only about 0.5% of all the music sold.

The root cause is the Apple, not the Newton

However, as a unit of music, the Album actually only suited one player in the music market: the music studios that were recording the albums. If you happen to be one of elder, you will surely remember moment when you bought a cassette or CD and you liked very much 2, maybe 3 songs from the whole album. The rest of it was, um, sort of crap. This, of course, irritated people, and as the music industry (some what negligibly) allowed computer technology to use magnetic tapes and CD’s to record data, these media became the Trojan horse music business. Unlike the vinyls, CD’s could have been burned (and thus copied) already by the regular people, which in turn led to a significant increase in piracy and the emergence of a separate section of shabby market stalls. Moreover, compact discs (unlike tapes) did not damage the original when copying. However, the final blow for the album metric unit was yet to come.

NEWTON_appleThe figurative last nail into Album’s coffin was an apple. In order to re-balance a reputation from the gravitational law (when fame was treacherously attributed entirely to Newton, and the apple got out of it with mere proverb “didn’t fall far from the tree.”) Taught by this crisis, this time the apple left nothing to chance and under its English pseudonym “Apple Inc.” brought the World the iTunes application. (which broke the album metric system for good). In Apple products, the music was suddenly available, God help us, by pieces. The world order has turned again from the head to its feet and you could buy (in the sense of the above analogy) sausages by pieces rather than by package loads.
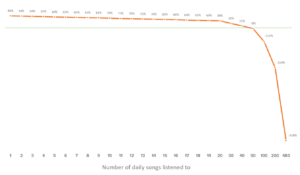
Those less patient could say “and here we can call it off, right?” After all, the music can still be bought in pieces (songs) until today. In fact, another important step in measuring music has made more difficult to measure again. If the iTunes step was called “unpacking music to pieces,” there has been another “re-wrap” over the past decade. Don’t worry, I don’t mean any parental responsibilities associated with distinct, uh, smell. (Although bad languages say that this re-wrapping has led to many: How is it fairly called? Poops?)

Thanks to companies like Spotify, the music began to be sold as subscription. Suddenly the pieces were no longer important, you could literally tap the whole stream of music. This move greatly simplified the music business, while the unit price of the song being in cents, collecting (remotely) a few cents from you after each song played is as if the bus driver stopped every 100 meters of ride to collect from all passengers a small fee for next 100 meters to come. (If it still seems pretty doable to you, think aircraft in very same analogy).

However, unlike a monthly transport ticket or fitness gym membership, Spotify subscription, even though linked to time interval (e.g. a month), does not assume that you will “run the service the whole month continuously” in this subscription. Thanks to great data from the book of A. McAffee and E. Brynjolfssona: “MACHINE, PLATFORM, CROWD , which depicts Spotify model in more detail, I can introduce you to Spotify’s gross margin (excl. overhead costs). For given number of songs listened to by  the regular user, their margin looks something like this:

From numbers above it is clear that Spotify firmly hopes that you will not listen to more than 45 songs per day (or 1300 per month). So, something like an eat-all-you-can restaurant that also assumes you haven’t come to her (literally) eat yourself over to the other world. The catch is, of course, that not everyone pays for Spotify. According to avaliable public data some form of the payment provides every second Spotify’s customer. Thus, leaving advertising revenue aside (and making a somewhat strong assumption that a paying user has more or less similar consumption as free user), Spotify can be profitable if its average user consumes no more than 750 songs a month.

But let’s revert from Spotify business model, back to what the emergence of music streaming services meant for the music units. The advent of iTunes brought us the easiest way to measure music, but Spotify subscriptions have made the clear waters muddy again. On top of that, though advent of iTunes and music streaming services has been massive, they have failed to cover the entire music market. And thus we have been left with somewhat strange cocktail of parallel, different music units, making the total commercial music consumption measurement a mess again. From Jake Brown’s data, (and few other music blogs) it is clear, that companies in the industry managed to agree on linking the different music units. Thus finally, at the end of this historical excursion, we worked our way to music being measured in three main units:                                                           

                                       1 500 SEA = 10 TEA = 1 ALBUM                , where

SEA = any (even unfinished) streaming of exactly 1 song, TEA = purchase (or download) of 1 paid song and ALBUM = simply the album as we know them from past.

Therefore, let me conclude this blog with some practical stats (potentially interesting to you, if you happen to swim through music topics) that arise from the music measurements units. Consumption of music with the advent of its media, digital purchasing and streaming services has increased rapidly. That might sound like it is worth being a musician, because the demand for listening to music is still growing.

In reality, this is so because we can now afford a trick, that was nor possible in “one concert unit” times: We are able to listen to the artists even after their death. However, the more crucial information is that the total amount of money people put into music (relatively steeply) fall from generation to another. According to the SoundScanData 2016 2016 study, in year of 2016 people paid for the music equivalent of 561 million albums. In 2000 it was 785 million albums. Consequently, there are 29% fewer units of money in music sales industry, which ever increasing number of living artists must gradually more and more share with the passed away ones. So if you’re considering a second career in your life, the music will probably be a very muddy path.

They invited me to write National AI Strategy. So I proposed to …

Have you ever thought about how artificial intelligence would really be at most useful for your country? I was “forced” to do so by fate. Therefore, let me briefly depict what I think should be the key invest areas in AI court; How to bring artificial intelligence even to rural areas? But first of all, how to make world-class AI here, ideally in local language?

Sometimes you dip into things you even don’t know how. This was the case also one day when a strange email landed in my mailbox. Don’t take me wrong, I really have experienced a lot of bizarre pieces in email communication. But this one was really strange. It was an invitation from the National Artificial Intelligence Forum that they would like me to join the team of experts assembled to create the National Strategy for Artificial Intelligence (AI) for our country.

At first, I wondered if this was not a joke from one of my friends. But since April 1 has been already pretty quite away, I started to seriously consider that someone really means it. “Why me?” I asked myself. After all, strategic documents of this kind are not my daily job and I don’t know much about national AI programs of other countries either. However, the authors of the email seemed to anticipate my embarrassment and they left nothing to chance. In the invitation, they explained that the expert team will combine 1] academic environment, 2] representatives of domestic AI research companies, and 3] business representatives who already use real AI technologies today. I quickly realized that I owed my invitation to the third group. So I exhaled in relief … and confirmed my participation.

If I decide to devout my time into something, I try to make it at least of some quality. Therefore, immediately after accepting the invitation, I started studying the AI strategies of other countries. However, I was not looking for ready-made measures that could be “borrowed”. Rather I tried to dive mainly into parts where those papers discussed ways of assessing the country’s initial situation. For I realized that for country strategy, I was just about to participate, it will not help to “invite” the measures chosen by US or China. Thus sooner that I took part in any round of measures brainstorming, I had crystallized the key AI assumptions in my head. These were (euclidean) premises I decided to defend as the starting point of group work. I am sure there could be a lot of “meditation” on the topic of AI maturity, but I tried to put my postulates into as few points as possible:

  • The country for which we are going to prepare an AI strategy is not one of the current AI leaders, nor even the leaders in AI research. Therefore, at least to start, we will have to build upon already existing foreign solutions. (it does not rule out research focus as such into the future, I just mean that we do not have enough of our national research to draw from there)
  • Although AI is a wide spread buzz-word, what it really means and how it can be used in business, is known only to limited communities of people, mostly associated in university cities. Even in mid-sized cities that do not have a university or in the countryside, no one (including a local pastor, bartender or mayor) has a clue about what true nature of artificial intelligence is and what its applications are. In other words, AI awareness is very unevenly geographically distributed across the country.
  • Most countries have a very specific language environment. If a relatively few people speak English in given country, recently available, foreign (NLP and other AI) solutions will not work well. If the implementation of AI in a country were to be based on English solutions, it would be very risky both in terms of quality of solutions and due to (possible) resistance by end-users. (If you are to understand a conceptually difficult thing, it is not very helpful if it is also primarily described in a foreign language that you do not speak)
  • The whole world runs primarily on open-source AI solutions. Even the most advanced companies publish (on GitHub) their libraries for AI solutions.
  • Let’s think for a moment. How to maximize the effect of AI on local companies in the country? I admit, this is also a bit of a personal belief dilemma, because any answer to this question can be suppressed with phrase “who knows, how it really will be”. Nevertheless, I personally believe that AI will reach its maxim, when even ordinary, small businessmen will embrace it.
  • I came to the previous conclusion  after also considering the fact that large, multinational companies will take care of the implementation of AI in their local subsidiaries. Large (abroad reaching) local companies will be pushed by competition from those other countries. The only group (in the first stage) that will not be guided to this are the national medium and small entrepreneurs. That is why, in my opinion, these should also be the focus areas of the national implementation strategy.
  • For SME companies, in addition to the language barrier, the “technological abyss” will also be important. Cloud environment is an inevitable prerequisite for most AI solutions design & maintenance today. However, it might be both costly and secondly unrealistic for a small business, as they cannot sustain their own full FTE Data Engineer and have no way to borrow a shared one either.

Enough of preparation, I police myself, and plunged into discussions about the initial strategy proposals. As it turned out later, the above three groups did not necessarily have a balanced representation in the expert team. The Task Force had to, therefore, often choke through proposals that ignored even several above mentioned premises simultaneously. Nonetheless, we ferociously adhered to the golden rule of brainstorming: every well-formulated idea would be included in the long list of possible measures. (knowing that we would have to subject those to more scrutiny later). Sometimes it was really painful for people in practice to withstand the tirades and their teeth were often clenched. After listening to all perspectives, I decided to nominate following draft proposal for the National AI strategy:

1] Create a hosted cloud solution at universities or one of the state institutions (based on a model like Amazon Web Services), as an extension on top of any of the commercially viable cloud alternatives. Using the central hosting/management of this repository, offer a ready-made, all-inclusive symbolically priced packages for AI solutions, which for end-users (and institutions) also include maintenance realized through experts paid by that central cloud provider. Simply turn-key cloud environments.

2] Localize some of the most wanted Udemy / Udacity / Cloudera / … artificial intelligence courses and basic Machine Learning and Deep Learning skills. Purchase a mass license for such localized courses for 100,000 residents in a given country and grant access to these courses for a symbolic amount (e.g. 5 EUR / person).

3] Create a moderate national community for Opensource solutions in the AI area. Collect and localize into national language information on new AI modules and their reviews by foreign experts. Create conditions for Slovak (research) teams to actively participate in the development of individual branches of these solutions.

4] Select 5-6 most important industries in SME segment of companies. Recruit at least one relevant large business per each area to provide local, anonymized data. Organize Hackathons with the participation of international teams, with aim to develop specific solutions for AI use in the industry and based directly on local data. Set conditions for participation in Hackathons so that the developed solutions can be freely picked-up and implemented in any company registered in the country and operating in selected industry.

5] After the implementation of Hackathons, for each industry recruit at least 4 volunteers from within already existing companies to be become pioneer beneficiaries of AI. In those pioneers Central AI agency, via means of a state grants, implements ready AI solutions (from Hackathons). In case of higher interest of the volunteers for pioneer status, a lottery with oversight a notary will be drawn to decide whom the grant ought to be awarded. Participation in the grant is subject to the approval of the company elaborated about in measure 6, see below.

6] Realize roadshows in the regions and district towns where AI and its concrete, ready-to-use solutions (acquired through Hackathon) will be presented. Representatives of pioneering companies with AI implemented under Measure 5 will be presenting at the meetings. instantly available, plug-and-play solution, free of charge and even in local language. If measures 4 + 5 + 6 are overly successful, repeat this procedure for other sectors.

What do you say? Does that make sense to you, or would you suggest something completely different? Well, I will not bore you with which  my actions had gained enough “support” for the final draft of the National Strategy. Some passed, others did not survive the fight and prioritization. But that’s not the point of this blog, anyway. In the sense of his unfinished blog title, I wanted to give you some food for  thought: What are the inputs for AI strategy in your country where you live? Would you suggest similar solutions for you homeland or do you have much better ideas? How to bring artificial intelligence to the rural village habitat? But first-mostly: How to build world-class AI and (preferably even) in the local language? So that ordinary John and Ann can take benefit of it important process as well.


NOAH 2019 inspirations – Part I. – BEST BUSINESS STRATEGIES

In the field of digital technologies and data there are some conferences in Europe worth seeing. On top of that, there are a few that you can feel really be sorry if missing them. Well, and at the top of this imaginary pyramid of know-how, there is a very short list of those conferences from which you will have goosebumps still several weeks after their closing. One such conference is the NOAH conference in Berlin, which I had the honor of attending few weeks ago. More than 500 speakers (yes, reading right) in 2 days for more than 4000 people in the audience (yes, reading it correctly again) will prepare a hailstorm that you would seek to recover from longer than over evening after-party. The conference is known to leave the presenters only 6-10 minutes, so you can hear 20 – 30 unique approaches of dealing with issues in a single 3-hour block. Pure massacre. I guess that after day one you wished you would have been rather landscaping all day long.

It is not possible to pass on such an airborne attack of ideas (if for nothing else, there are always 4-5 parallel streams running, so unless you have arrived as wide team, you have no chance to see all the agenda). However, I will try to convey to you at least the coolest thing that our team saw into a three-parts-long blog.

PART I – BEST DIGITAL BUSINESS STRATEGIES

In following section your jaw might struggle to bounce back from the dropped position because the paths to success, chosen by the below listed companies, are not only brutally functional but also unconventional on top of it. Well, see for yourself:

NOAH_EXPONDOExpondo, as company name, will certainly not ring the bell with you. That is so, because it is precisely part of their strategy. Nevertheless, even over our ignorance, they are market leader in the production of professional poppers, micro-scales (among others allegedly used also by drug cartels) or other niche products that you might not even realize that exist. In everything they produce, they strive to be in the world’s top 3. Ehm, yet another niche, no-name business, you might think. The “problem” is that Expondo launches annually more than 1,000 (!!) new products. That is, about 5 news items every working day. What is more, only 4% percent of their releases will not turn into world-wide hits. Having a niche, inconspicuous products, they manage to produce and sell these products with a (whooping) 56% margin. So just to summarize: Do you know any other company that launches 960 world-successful products per year and sells them with margin equal to half of its revenue?

The fashion (clothing) market is rather tight. Thus, looking for a new, unique approach to business strategy resembles famous needle in a haystack. Though, OUTFITTERY.com has found its way through  rain-forest of other clothing retailers. They bet is a private label constructed purely on data basis. Collecting about 50 dimensions on each product and more than 200 data features about each client (which would not be so shocking by itself, Telcos hold thousands data points per client) gives this e-retailer chance not to leave its clients “wandering around” on the internet. Unbelievable (almost) half of all purchases originate directly from the portal’s recommendation. TheNOAH_OUTFITTERY underlying data analytics engines are so well-tuned that from over 1 million clients portfolio, incredible 40% of customers are so satisfied with what Outfitters have recommended to them that they choose to activate subscription. This works by sending items on a monthly basis that they have never seen before nor indicated any preference for them, yet they like them so much that they keep them. Clients have literally outsourced their wardrobe to the e-shop. And all this is happening in so taste sensitive and demanding industry as fashion is.

Did you know that there is a separate spice e-shop? Well, nowadays we are used to having a dedicated E-shop on everything, so the very existence of JUST SPICES will probably not surprise you. On the other hand, what raises the quills is the fact that this portal has taken on the task of bringing emotions to the spice purchases. Surveys among people have found that many shopping for spices compare to buying socks: “You choose to buy them only when you run out of them and just because you need them”. Approach they used to bring soul to purchase of these (often deemed) commodities is, in fact, remarkable. For their own brand of 150 spices, they have built a strong Instagram (over 220,000 followers), podcasts and even the Influencers’ network. However, that is not the limit of their uniqueness. Since spices are still sold primarily in brick-and-mortar stores, Just Spices has managed to introduce nearly 95 different products into some retail chains, mainly thanks to 47 different (patented) ways to (witty) place spice as a complementary item in the traditional stores.

NOAH_SupplementerThe industry, which has long been stumbling somewhere on the interface between small e-shops and (even smaller) off-line stores, is selling nutritional supplements (especially for bodybuilding or fitness). The Supplementer.com portal is a very interesting way of simultaneous (and synergistic) activity both in on-line and off-line; In addition to the private label, which is common in the industry and in CEE it is smartly operated by GymBeam (for example), the Supplementer.com has also launched several cunning ways of selling their products. The portal understood that their target group was hard to be targeted by general advertising and needs to be addressed mainly along their practicing, in the gym. However, the gyms are numerous and fragmented and often there is not much room for the placement of “own” stalls in the gym premises. Therefore, Supplementer came up with ideas like using QR walls and wending machines to overcome these problems.

Among the predominantly online-functioning portals, the NOAH 2019 conference also featured a truly traditional players. Coca Cola, confirmed that even giants can innovate. Its representatives have introduced the system developed for their drink selling partners. Using external data (such as social events in a given location, weather, competing product campaigns …) embedded directly into ordering system by Coca Cola, the application can better predict the demand for Coca Cola beverages and thus prevent demand being under-served due to low stocks. To cement the credibility of the application, the partner can review the entire history of the given recommendations (and their accuracy) for each type of partner at real stores of the providing data as the transparent partners.

If you follow the market for mobility services, names like DriveNow (from BMW) or Car2go (from Mercedes) are probably familiar to you. However, fewer people know that these hitherto competing platforms have taken an unprecedented step and merged into a shared ShareNow service. Together, in 31 cities around the world, they offer more than 20,000 cars (of one of the original brands) to unlock with mobile phones, which you can pick up at any time. Just like bike-sharing programs around the world or the newly launched Sharengo.sk service in Slovakia. The company shared interesting data by revealing that in the cities where car-sharing works, it is at least 30% cheaper than taxis. Equally interesting is the fact that the average city car is utilized only 2% of the total time. The remaining 98% of the time it is waiting for the owner somewhere in the parking lot or in garage. What is fascinating  that ShareNow’s cars aim to get their cars’ utilization up to almost 50% during the day, which means that if these services start running widely, single car-sharing vehicle can replace up to 25 passenger cars.

Even data services based on mobile operators’ data inputs are not unheard of in Europe. Instarea.com has been around for years, and has been behind several interesting studies onNOAH_Porsche human movement. However, with the advent of new trends in mobility, these data points are taking on completely new fields of application. A much larger sibling of Instarea, the Teralytics.net, for example, has from the anonymous mobile data of moving people predicted, where is the best to place e-car charging stations (and also foresees demand for charging in each part  of the day). They are also involved in launching car-, bike- and other sharing services as they can accurately identify the need for people to move and, on to of all, also what is approximate creditworthiness of those potential clients. Perhaps the most exotic use of geo-movement  data is for planning first lines and heliports for Air-taxis, which are emerging as another form of transport in advanced cities.

An old saying preaches: If you damn good in something, you better stick to your trade. But what if you can do very well something that is not the object of your business? Portal lastminute.com, primarily providing last minute holiday deals for end customers, has found itself in similar situation. Since their whole existence is based on how effectively they can do online marketing of individual destinations and hotels, they have become a hell of a good player in that area. Instead of hovering on the ego and showing their opponents a long nose, they decided to use this ability and turn it into separate line of their business. Therefore, nowadays they run also an digital marketing agency for individual resorts taking care of their marketing presentation even outside their very own portal.

The last company in this first block of inspiration from NOAH 2019 conference is Thermondo.de. They chose an interesting goal as their mission. Aspiration is to change the traditional heat supply sector, where (often) monopoly heat utilities (either on gas or electricity basis) have only very shallow relationships with the end customers. Many consider heating simply to be a commodity. However, Thermondo, which also acts as alternative supplier of gas and electricity, builds also its own boilers. You do not need to invest in purchase of boiler, neither care about their installation or maintenance. The company will provide you with heat (in a family house or apartment) as a subscription. This includes not only the heating medium at a flat rate per month, but also the full installation of heat units, boilers or radiators hardware, even their replacement for new ones throughout the subscription period. Customers can thus afford higher quality equipment, for which they would have not only to sink high initial costs, but also hope that boiler survives till real estate divestment and that they will be able to sell it (at least) partially within the property strike price.

>>>  continue READING HERE

You have just read the first part of the inspiration from NOAH 2019 conference. You can read more fascinating information from this conference in the second or third part of this mini series.